Data Model
Background: The IAMC timeseries scenario data format
Over the past decade, the Integrated Assessment Modeling Consortium (IAMC) developed a standardised tabular timeseries format to exchange scenario data related to energy systems modelling, land-use change, demand sectors, and economic indicators in the context of climate change and the the Sustainable Development Goals. Previous high-level use cases include reports by the Intergovernmental Panel on Climate Change (IPCC) and model comparison exercises within the Energy Modeling Forum (EMF) hosted by Stanford University.
The table below shows a typical example of integrated-assessment scenario data
following the IAMC format from the Horizon 2020 CD-LINKS project.
The pyam package was initially developed for analysis and visualization
of any scenario data provided in this format.
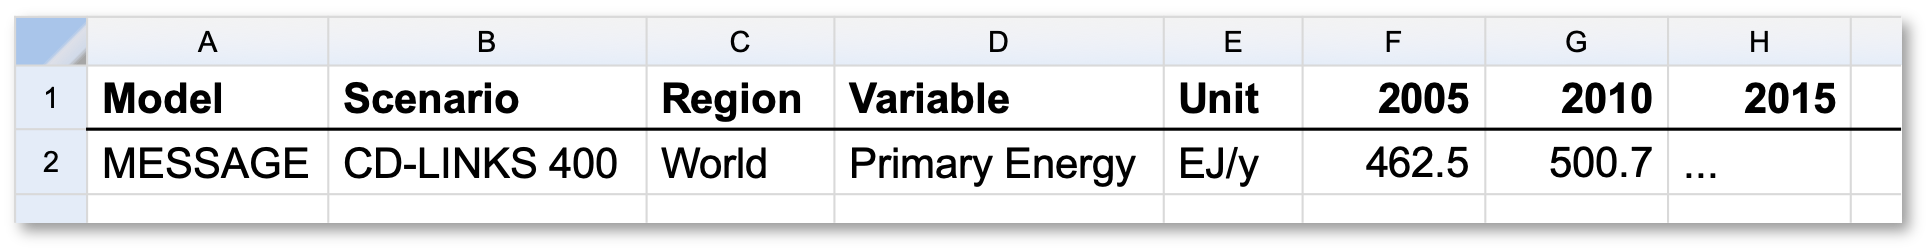
Illustrative example of IAMC-format timeseries data
via the IAMC 1.5°C Scenario Explorer
Refer to https://data.ece.iiasa.ac.at/ for a selected list of previous projects using the IAMC data format.
The pyam data model
A pyam.IamDataFrame instance is a container for two types of data:
Scenario timeseries data (‘data’)
This attribute holds the timeseries data related to an ensemble of scenarios. The data follows the format established by the IAMC shown above. It has the following standard columns (i.e., index dimensions, coordinates):
model
scenario
region
variable (more info on variables)
unit
year/time (more info on the temporal domain)
When initializing an IamDataFrame, the timeseries data can be provided
in long format, where each datapoint is one row in a column named ‘value’,
or it can follow the standard IAMC-style wide format (see the example above),
where each timeseries is one row and the timesteps are represented as columns.
Refer to the the data-table tutorial
for more information.
The attribute data returns the timeseries data
in long format as a pandas.DataFrame, while
the method timeseries() returns
an indexed pandas.DataFrame in wide format.
Exporting an IamDataFrame to file using
to_excel() or
to_csv() also writes the data table
in wide format.
Note
If there are numpy.nan in a pandas.DataFrame
or empty cells in xlsx/csv files when initializing an IamDataFrame,
it will behave as follows:
column |
behaviour |
|---|---|
‘value’ |
ignore/drop ‘nan’ |
‘unit’ |
replace ‘nan’ by an empty string ( |
all other |
raise an error |
Hence, if you are adding variable/region-specific meta information to ‘data’, you need to make sure that you add a value to every single row.
The reason for that implementation is that pandas does not work as expected with ‘nan’ in some situations (see here and here). Therefore, enforcing that there are no ‘nan’s in an IamDataFrame ensures that pyam has a clean dataset on which to operate.
The ‘variable’ column
The ‘variable’ column (or coordinate) describes the type of information represented
in the specific timeseries.
The variable implements a “semi-hierarchical” structure
using the | character (pipe, not l or i) to indicate the depth.
Variable names (should) follow a structure
like Category|Subcategory|Specification.
Semi-hierarchical means that a hierarchy can be imposed, e.g., one can enforce
that the sum of Emissions|CO2|Energy and Emissions|CO2|Other
must be equal to Emissions|CO2
(if there are no other Emissions|CO2|… variables).
However, this is not mandatory, e.g., the sum of Primary Energy|Coal,
Primary Energy|Gas and Primary Energy|Fossil should not be equal
to Primary Energy because this would double-count fossil fuels.
Refer to the variable list in the documentation pages of the IAMC 1.5°C Scenario Explorer to see the full list of variables used in the recent IPCC Special Report on Global Warming of 1.5 ºC (SR15).
The temporal domain
In its original design, the IAMC data format (see above) assumed that the temporal dimension of any scenario data was restricted to full years represented as integer values. In this case, the time index is named ‘year’.
Two additional use cases are supported by pyam:
continuous-time timeseries data by using an index named ‘time’
populated bydatetime.datetimeinstances (replacing the ‘year’ index)representative sub-annual timeslices via the extra-columns feature
Please reach out to the developers to get more information on this ongoing work.
Custom extra-columns of the ‘data’ table
If an IamDataFrame is initialised with columns that are not in the
list above nor interpreted as belonging to the time dimension (in wide format),
these columns are included in the ‘data’ table as custom extra-columns.
This feature can be used, for example, to distinguish between multiple
climate models providing different values for the variable
Temperature|Global Mean.
It can also be used to describe “representative timeslices”, e.g.,
“summer-day”, “winter-night”, … by adding an extra-column “subannual”.
Warning
Not all pyam functions currently support the continuous-time format or custom columns in a ‘data’ table. Please reach out via the mailing list or GitHub issues if you are not sure whether your use case is supported.
Quantitative and qualitative indicators of scenarios (‘meta’)
This attribute is intended for categorisation and quantitative indicators at the model-scenario level. Examples in the SR15 context are the warming category (‘Below 1.5°C’, ‘1.5°C with low overshoot’, etc.) and the cumulative CO2 emissions until the end of the century.
When performing operations such as rename()
or append(),
pyam attempts to keep the information in ‘meta’ consistent with
the ‘data’ dataframe.
Note
The ‘meta’ table is not intended for annotations of individual
data points. If you want to add meta information at this level
(e.g., which stylized climate model provided the variable
Temperature|Global Mean, or whether a data point is from the
original data source or the result of an operation), this should operate on
the ‘data’ table of the IamDataFrame using the
custom-columns feature (see extra-columns above).
Filtering
The pyam package provides two methods for filtering scenario data:
An existing IamDataFrame can be filtered using
filter(col=...),
where col can be any column of the ‘data’ table (i.e.,
‘model’, ‘scenario’, ‘region’, ‘unit’, ‘year’/’time’ or any extra-columns),
or a column of the ‘meta’ table. The returned object is
a new IamDataFrame instance.
A pandas.DataFrame (‘data’) with columns or index
[‘model’, ‘scenario’] can be filtered by any ‘meta’ columns from
an IamDataFrame (df) using
pyam.filter_by_meta(data, df, col=..., join_meta=False).
The returned object is a pandas.DataFrame down-selected to those
models-and-scenarios where the ‘meta’ column satisfies the criteria given
by col=... .
Optionally, the ‘meta’ columns are joined to the returned dataframe.