Plotting GalleryΒΆ

All examples in this gallery currently use the IAMC template for yearly data, but pyam also supports timeseries data with a sub-annual resolution. Please read the Data Model section for more information.

For more information about the plotting module, refer to the plotting API documentation.
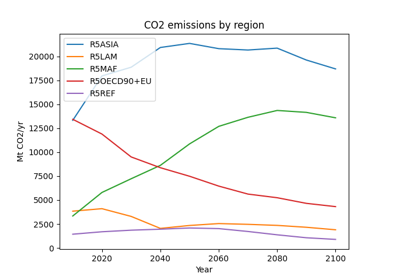
Timeseries data charts

Timeseries data charts

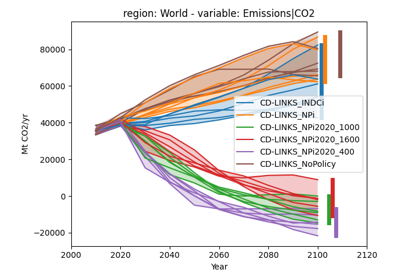
Ranges of timeseries data

Ranges of timeseries data

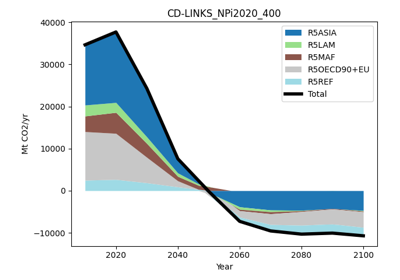
Stacked line charts

Stacked line charts

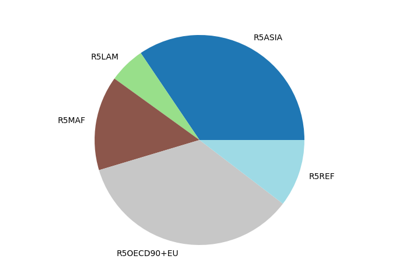
Pie chart visualizations

Pie chart visualizations

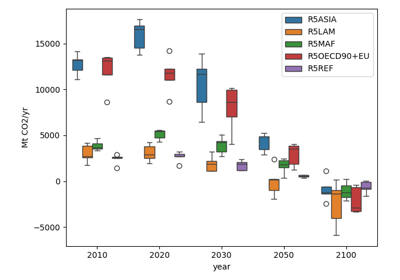
Boxplot charts

Boxplot charts

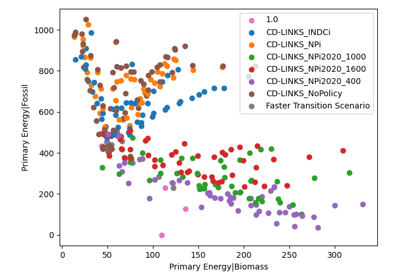
Scatter plot

Scatter plot

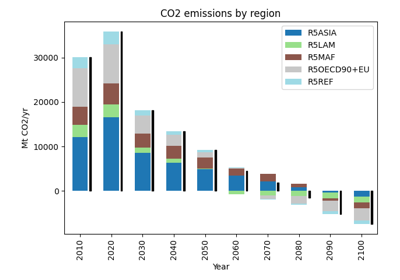
Stacked bar charts

Stacked bar charts

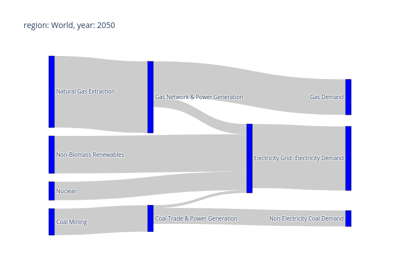
Sankey diagram

Sankey diagram

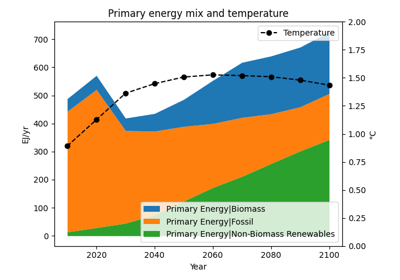
Composing plots with a secondary axis

Composing plots with a secondary axis

Download all examples in Python source code: gallery_python.zip

Download all examples in Jupyter notebooks: gallery_jupyter.zip

Gallery generated by Sphinx-Gallery

Logo

pyam

analysis and visualization
of integrated-assessment
& macro-energy scenarios

Navigation

  • Installation
  • Authors and Developers
  • Support and Contributing
  • Data Model
  • Tutorials
  • Plotting Gallery
    • Timeseries data charts
    • Ranges of timeseries data
    • Stacked line charts
    • Pie chart visualizations
    • Boxplot charts
    • Scatter plot
    • Stacked bar charts
    • Sankey diagram
    • Composing plots with a secondary axis
  • Integration with R
  • API Reference

Quick search

©2017-2023, IIASA and the pyam developer team. | Powered by Sphinx 6.1.3 & Alabaster 0.7.13 | Page source