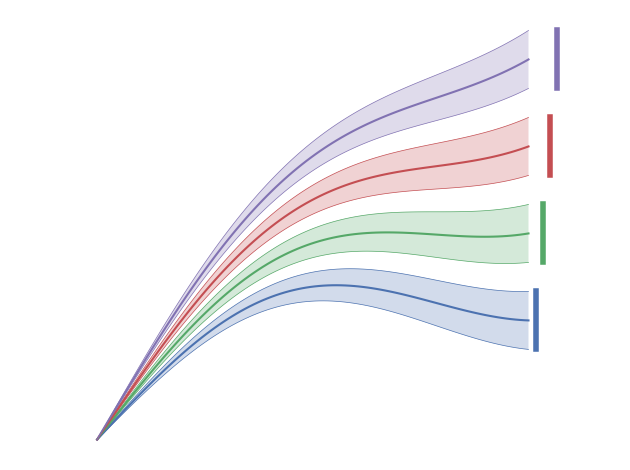
Make our Logo!
The logo combines a number of fun pyam features, including
line plots
filling data between lines
adding ranges of final-year data
[1]:
import matplotlib.pyplot as plt

plt.style.use("seaborn-v0_8-deep")
[2]:
import numpy as np


def func(x, factor):
    return np.sin(x) + factor * x


x = np.linspace(0, 4, 100)
[3]:
import itertools

import pandas as pd

from pyam import IAMC_IDX, IamDataFrame

combinations = itertools.product(["m1", "m2", "m3", "m4"], ["s1", "s2", "s3"])
data = [
    [m, s] + ["r", "v", "u"] + list(func(x, 0.5 + 0.1 * i))
    for i, (m, s) in enumerate(combinations)
]
df = IamDataFrame(pd.DataFrame(data, columns=IAMC_IDX + list(range(len(x)))))
/home/docs/checkouts/readthedocs.org/user_builds/pyam-iamc/checkouts/latest/pyam/utils.py:318: FutureWarning: The previous implementation of stack is deprecated and will be removed in a future version of pandas. See the What's New notes for pandas 2.1.0 for details. Specify future_stack=True to adopt the new implementation and silence this warning.
  .stack(dropna=True)
[4]:
df.head()
[4]:
| model | scenario | region | variable | unit | year | value | |
|---|---|---|---|---|---|---|---|
| 0 | m1 | s1 | r | v | u | 0 | 0.000000 |
| 1 | m1 | s1 | r | v | u | 1 | 0.060595 |
| 2 | m1 | s1 | r | v | u | 2 | 0.121124 |
| 3 | m1 | s1 | r | v | u | 3 | 0.181522 |
| 4 | m1 | s1 | r | v | u | 4 | 0.241722 |
[5]:
fig, ax = plt.subplots()
df.filter(scenario="s2").plot(ax=ax, color="model", legend=False, title=False)
df.filter(scenario="s2", keep=False).plot(
    ax=ax, linewidth=0.5, color="model", legend=False, title=False
)
df.plot(
    ax=ax,
    alpha=0,
    color="model",
    fill_between=True,
    final_ranges=dict(linewidth=4),
    legend=False,
    title=False,
)
plt.axis("off")
plt.tight_layout()
fig.savefig("logo.pdf", bbox_inches="tight", transparent=True, pad_inches=0)
