pyam: analysis and visualization
of integrated-assessment & macro-energy scenarios
Release v3.4.0.


![]()
![]()

![]()
Overview
The open-source Python package pyam provides a suite of tools and functions
for analyzing and visualizing input data (i.e., assumptions/parametrization)
and results (model output) of integrated-assessment models,
macro-energy scenarios, energy systems analysis, and sectoral studies.
The source code is available on Github. See also the related Scientific publications.
Key features
Simple analysis of scenario timeseries data with an interface similar in feel & style
to the widely usedpandas.DataFrameAdvanced visualization and plotting functions (see the gallery)
Features for scripted validation & processing of scenario data and results
Timeseries types & data formats
Yearly data
The pyam package was initially developed to work with the IAMC template,
a timeseries format for yearly data developed and used by the
Integrated Assessment Modeling Consortium (IAMC).
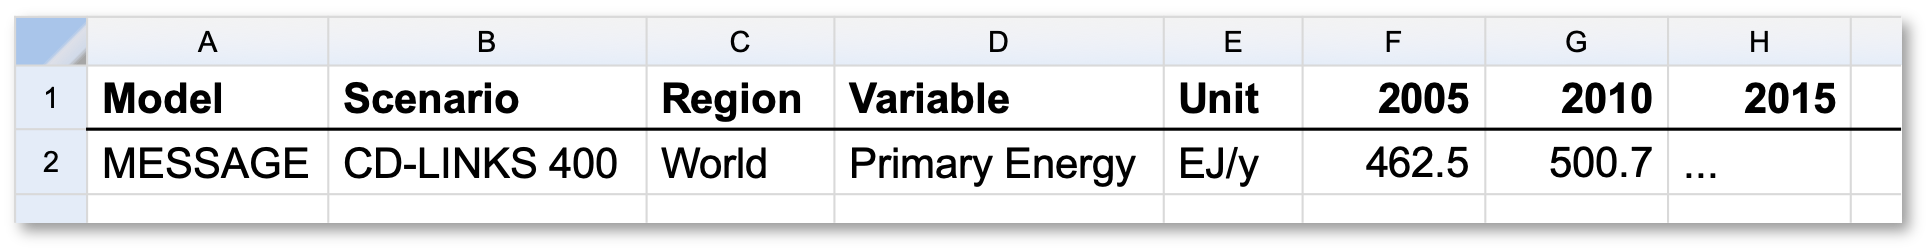
Illustrative example of IAMC-format timeseries data
via the IAMC 1.5°C Scenario Explorer
Subannual time resolution
- The package also supports timeseries data with a sub-annual time resolution:
Continuous-time data using the Python datetime format
“Representative timeslices” (e.g., “winter-night”, “summer-day”)
using the pyam extra-columns feature
Please read the Data Model section for more information
or look at the data-table tutorial
to see how to cast from a variety of timeseries formats to an IamDataFrame.
Table of Contents
Scientific publications
The following manuscripts describe the package at specific stages of development.
The source documents are available in the manuscripts folder of the GitHub repository.
Release v1.0 (June 2021)
Published to mark the first major release of the pyam package.
Daniel Huppmann, Matthew Gidden, Zebedee Nicholls, Jonas Hörsch, Robin Lamboll, Paul Natsuo Kishimoto, Thorsten Burandt, Oliver Fricko, Edward Byers, Jarmo Kikstra, Maarten Brinkerink, Maik Budzinski, Florian Maczek, Sebastian Zwickl-Bernhard, Lara Welder, Erik Francisco Álvarez Quispe, and Christopher J. Smith.pyam: Analysis and visualisation of integrated assessment and macro-energy scenarios.Open Research Europe, 2021. doi: 10.12688/openreseurope.13633.2
Release v0.1.2 (November 2018)
Published following the successful application of pyam
in the IPCC SR15 and the Horizon 2020 CRESCENDO project.
Matthew Gidden and Daniel Huppmann. pyam: a Python package for the analysis and visualization of models of the interaction of climate, human, and environmental systems.Journal of Open Source Software (JOSS), 4(33):1095, 2019. doi: 10.21105/joss.01095
Copyright & License
The development of the pyam package was started at the IIASA Energy Program,
with contributions from a number of individuals & institutions over the years.
The package is available under the open-source Apache License. Refer to the NOTICE in the GitHub repository for more information.