Note
Go to the end to download the full example code.
Scatter plot
Read in tutorial data and show a summary
This gallery uses the scenario data from the first-steps tutorial.
If you haven’t cloned the pyam GitHub repository to your machine, you can download the file from https://github.com/IAMconsortium/pyam/tree/master/docs/tutorials.
Make sure to place the data file in the same folder as this script/notebook.
import matplotlib.pyplot as plt

import pyam

df = pyam.IamDataFrame("tutorial_data.csv")
df
<class 'pyam.core.IamDataFrame'>
Index:
 * model    : AIM/CGE 2.1, GENeSYS-MOD 1.0, ... WITCH-GLOBIOM 4.4 (8)
 * scenario : 1.0, CD-LINKS_INDCi, CD-LINKS_NPi, ... Faster Transition Scenario (8)
Timeseries data coordinates:
   region   : R5ASIA, R5LAM, R5MAF, R5OECD90+EU, R5REF, R5ROWO, World (7)
   variable : ... (6)
   unit     : EJ/yr, Mt CO2/yr, °C (3)
   year     : 2010, 2020, 2030, 2040, 2050, 2060, 2070, 2080, ... 2100 (10)
Show relation of variables
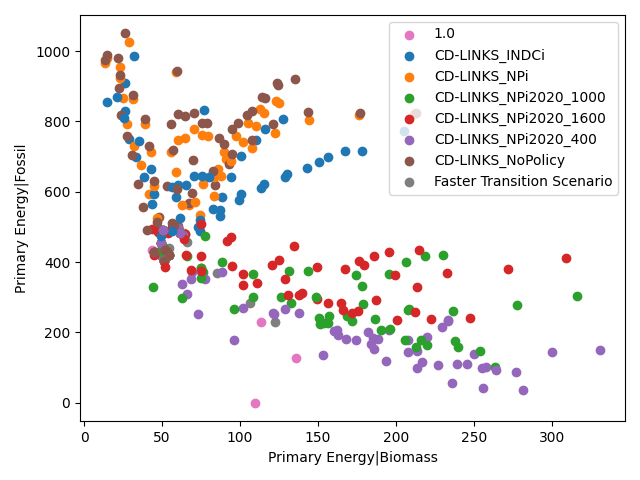
In the first example, we show the relation between two variables, biomass and fossil energy use.
data = df.filter(region="World")

data.plot.scatter(
    x="Primary Energy|Biomass", y="Primary Energy|Fossil", color="scenario"
)
plt.tight_layout()
plt.show()
Show a scatter plot of meta indicators
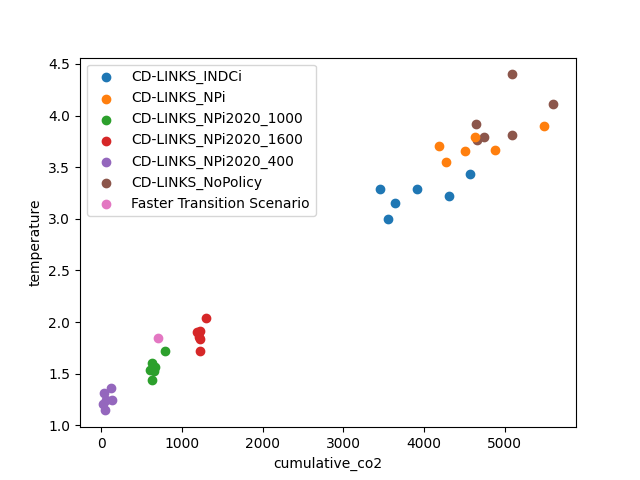
In the second example, we show the relation between two meta indicators computed from the timeseries data.
Cumulative CO2 emissions
The first indicator computes the cumulative CO2 emissions from 2020 until the end of the century.
co2 = (
    df.filter(region="World", variable="Emissions|CO2")
    .convert_unit("Mt CO2/yr", "Gt CO2/yr")
    .timeseries()
)

df.set_meta(
    meta=co2.apply(pyam.timeseries.cumulative, first_year=2020, last_year=2100, axis=1),
    name="cumulative_co2",
)
Temperature at the end of the century
The second indicator takes the value of the temperature variable in the latest year and assigns it as a meta indicator.
temperature_var = "AR5 climate diagnostics|Temperature|Global Mean|MAGICC6|MED"
df.set_meta_from_data(name="temperature", variable=temperature_var, year=2100)
Draw the scatter plot!
df.plot.scatter(x="cumulative_co2", y="temperature", color="scenario")
<Axes: xlabel='cumulative_co2', ylabel='temperature'>
Total running time of the script: (0 minutes 0.665 seconds)