Using IPCC Color Palettes
pyam supports the use of explicit IPCC AR5 and AR6 color palettes by providing the RCP and/or SSP of interest via the pyam.run_control() feature.
The full list of the IPCC color palette colors available in pyam can be retrieved by the following code.
[1]:
import pandas as pd

import pyam

colors = pyam.plotting.PYAM_COLORS
pd.DataFrame({"name": list(colors.keys()), "color": list(colors.values())})
[1]:
| name | color | |
|---|---|---|
| 0 | AR6-SSP1 | #1e9583 |
| 1 | AR6-SSP2 | #4576be |
| 2 | AR6-SSP3 | #f11111 |
| 3 | AR6-SSP4 | #e78731 |
| 4 | AR6-SSP5 | #8036a7 |
| 5 | AR6-SSP1-1.9 | #00a9cf |
| 6 | AR6-SSP1-2.6 | #003466 |
| 7 | AR6-SSP2-4.5 | #f69320 |
| 8 | AR6-SSP3-7.0 | #df0000 |
| 9 | AR6-SSP3-LowNTCF | #e61d25 |
| 10 | AR6-SSP4-3.4 | #2274ae |
| 11 | AR6-SSP4-6.0 | #b0724e |
| 12 | AR6-SSP5-3.4-OS | #92397a |
| 13 | AR6-SSP5-8.5 | #980002 |
| 14 | AR6-RCP-2.6 | #003466 |
| 15 | AR6-RCP-4.5 | #709fcc |
| 16 | AR6-RCP-6.0 | #c37900 |
| 17 | AR6-RCP-8.5 | #980002 |
| 18 | AR5-RCP-2.6 | #0000FF |
| 19 | AR5-RCP-4.5 | #79BCFF |
| 20 | AR5-RCP-6.0 | #FF822D |
| 21 | AR5-RCP-8.5 | #FF0000 |
| 22 | AR6-C1 | #97CEE4 |
| 23 | AR6-C2 | #778663 |
| 24 | AR6-C3 | #6F7899 |
| 25 | AR6-C4 | #A7C682 |
| 26 | AR6-C5 | #8CA7D0 |
| 27 | AR6-C6 | #FAC182 |
| 28 | AR6-C7 | #F18872 |
| 29 | AR6-C8 | #BD7161 |
| 30 | AR6-IMP-LD | #4FA7BF |
| 31 | AR6-IMP-Ren | #2B7C8B |
| 32 | AR6-IMP-SP | #004D52 |
| 33 | AR6-IMP-Neg | #84A12B |
| 34 | AR6-IMP-GS | #6E7895 |
| 35 | AR6-IP-ModAct | #F29424 |
| 36 | AR6-IP-CurPol | #E31F2B |
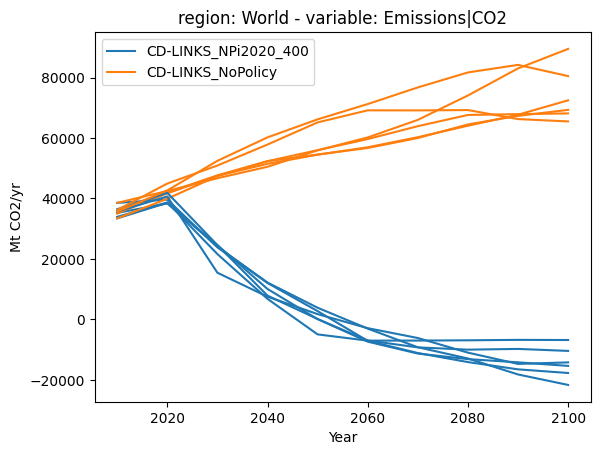
Display scenario data with default colours
We use the scenario ensemble from the first-steps tutorial (here on GitHub and on read the docs). Let’s pull out two example scenarios (implemented by multiple modelling frameworks each) and plot them with the default color scheme.
[2]:
scenarios = ["CD-LINKS_NoPolicy", "CD-LINKS_NPi2020_400"]

df = pyam.IamDataFrame(data="tutorial_data.csv").filter(
    variable="Emissions|CO2", region="World", scenario=scenarios
)

df.plot(color="scenario")
[INFO] 18:44:37 - pyam.core: Reading file tutorial_data.csv
[2]:
<Axes: title={'center': 'region: World - variable: Emissions|CO2'}, xlabel='Year', ylabel='Mt CO2/yr'>
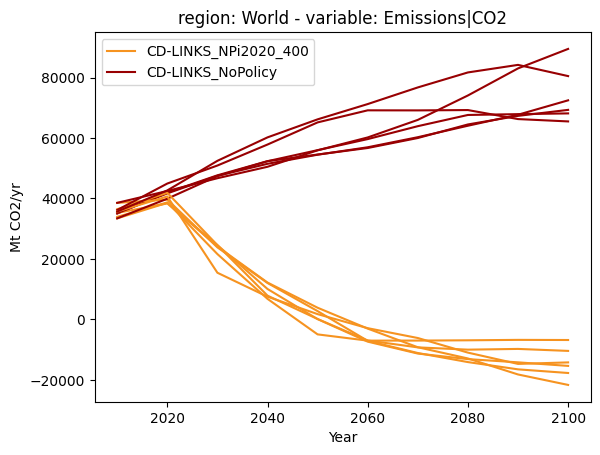
As an example, we assume that each of these two sets of scenarios correspond to categorizations in the AR6 context. We can utilize the specific colors by following two steps:
Update
pyam.run_control()telling it which scenario name maps to which AR6 colorCall
line_plotusing that color mapping
Updating the run control
We need to tell pyam that whenever it sees a certain scenario name, it should use a specific color from the IPCC palette.
[3]:
color_map = {
    "CD-LINKS_NPi2020_400": "AR6-SSP2-4.5",
    "CD-LINKS_NoPolicy": "AR6-SSP5-8.5",
}

pyam.run_control().update({"color": {"scenario": color_map}})
The illustration above is implemented directly in Python code, but it also works by specifying the desired mapping in a yaml configuration file and loading that file into run_control().
Use the new colors
Now, it’s as simple as calling the plot function again!
[4]:
df.plot(color="scenario")
[4]:
<Axes: title={'center': 'region: World - variable: Emissions|CO2'}, xlabel='Year', ylabel='Mt CO2/yr'>